

Jared Lander rose to fame as the Predictive Pizza Guy, but he only took his academic pursuits up to the Masters Level at Columbia ( I believe Columbia awarded me a Master's Degree when they asked me to leave and never return). Over the past couple of weeks a number of people have said to me that Jared should return to school to complete his education. Their arguments, although persuasive, were purely academic, and I do not believe they would have much traction with someone whose fame has burned so brightly as a result of Pizza. So I have compiled a top ten list of reasons that might inspire Jared to return to the academic world:
10. PhD students do not pay tuition.
9. If you a starving graduate student, you friends will pay for your drinks.
8. As a PhD candiate you can play of the University Club Hockey Team.
7. Since you wrote your Master thesis on Pizza, you can write your Doctoral thesis on some other vice like booze or women.
6. You get summers off to go to Asia to meet women who are your "type".
5. Your parents will continue to support you while you complete your education no matter how long that might take.
4. As a Doctoral candidate in a Math or Engineering Field you are highly likely to be surrounded by female students that are your "type".
3. Every Jewish Mother wants their son to be a "doctor".
2. Your parents will not pressure you to get married before you complete your education.
1. Chicks dig the Doctorate.
Subscribe To My Blog
Monday, December 5, 2011
Wednesday, November 16, 2011
Does the NFL realy need Kickoffs?
This year the NFL moved the spot for the Kickoff up five yards and limited the run up for players to five yards as well. The stated goal of this was to reduce injury, but I am not sure I agree with that position. If the goal was to reduce injuries on kickoffs, they would have eliminated the two man wedge. Wedges have been an ongoing problem with football since inception. Players using interlocking wedge formations in the early years of football caused so many injuries and deaths that it threatened the future of the game itself. It was only the intervention of President Theodore Roosevelt himself that saved the game by implementing rules that reduced injuries and deaths while emphasizing sportsmanship. There are lots of Articles on this, but I like this simple one by the Theodore Roosevelt Association which I will reprint here:"
President Roosevelt saves the game. . .
Strange as it may seem, high school football, college football, and even the Super Bowl might not exist today if President Theodore Roosevelt had not taken a hand in preserving the game. As originally played on college campuses, the game was extremely rough, including slugging, gang tackling and unsportsmanlike behavior. Quite a number of players died (18 in just the year 1905 alone, with 20 times fewer players than there are today). Interest in becoming a football player was declining!
But Roosevelt saw merit in the game. It built bodies and could build character, a sense of team and never giving up. Ten of the Rough Riders, the soldiers who fought with him in Cuba, gave their occupations as football players when they enlisted in 1898.
So in 1905, President Roosevelt summoned representatives of the Big Three (Harvard, Yale and Princeton, the universities who first played the game and who also set the rules of play) to the White House. In his best table-thumping style, Theodore Roosevelt convinced them that the rules needed to be changed to eliminate the foul play and brutality.
As a result, the American Football Rules Committee was formed and, in 1906, plays designed to open up the game and make it less dangerousd to play were introduced. Some of the changes made included:
- the introduction of the forward pass,
- the distance to be gained for a first down increased from five to ten yards,
- all mass formations and gang tackling were banned.
Football became less dangerous to play, injuries and deaths decreased, and it became more fun to watch.
Adapted from:
The Roosevelt Rough Writer: the newsletter for volunteers in park at Sagamore Hill, Vol 1, Issue 4, Jan. 17, 1998
The NCAA web site, fall 1999, http://www.ncaa.org/about/history.html"
There were real problems with the way football was played in 1905. There were 18 deaths in that single year which is a shocking number considering how few people who actually played the game! The death per year for football has decreased since then to its current rate of around 4 deaths per year. Most of this improvement can be attributed to rule changes and better safety equipment.
I did not die playing football, and I was never very good. The best thing that can be said about my playing career is that I had really good seats. However, I did get a ton of injuries. My knees are shot, one hip is just not right, and I have spinal issues. I believe most of those issues would not have happened with better coaching early in my career and more rule changes to protect the head and lower body. Improved equipment always helps as well.
I ran across this article about injury rates in the NFL over the last decade. I think this is a disturbing trend because it shows an upward tend injuries in all facets of the game:
"
Sep 11, 2011
Will the New Kickoff Rules Really Reduce Injuries?
 The NFL play-by-play reports when players are injured on each play, or at least when the injury stops play so trainers can attend to the injured player. These are far from 100% all injuries suffered in the course of play, but they are the ones that tend to be significant or severe--ACLs, broken bones, separated shoulders, concussions--the kind of things that really worry players, teams, and the league.
 With that information in hand, we can see the injury rates for each type of play, including kickoffs.

Injuries are increasing for all types of plays over the last decade. Last season, the injury rate was 1.6% on runs, 1.5% on passes, 1.3% on punts, and 2.0% on kickoffs. The graph illustrates there is something systemic at work increasing injuries at predictably steady rate, or at least increasing the reporting of injuries. Because of the very real concern around the NFL, I'd assume most of the increase is real.
(If I had to guess, the simultaneous near-doubling of injuries on all play types between 2004 and 2005 could be due to an increased effort to report injuries in the play-by-play. But even accounting for that jump, injuries are still steadily on the rise. I also suspect the drop in injuries in 2010 for passes and runs may not be just statistical noise and could be due to enforcement of helmet-to-helmet hits.)
Increasing the number of touchbacks will certainly reduce the number of kickoff injury rates simply by reducing the number of return plays. Needless to say, the fewer the kick returns there are, the fewer the injuries there will be. The question becomes: How much of a reduction can the NFL expect?
It's hard to estimate how many more touchbacks there will be under the new rules. Kickers may kick higher but shorter, or returners may decide to return the ball from deeper in the endzone than in previous years due to the shorter run-up allowed to the coverage team. But there is preseason data to work with. Because of weather factors (temperature is far more important to kick distances than most think) and other considerations, we'll compare the 2010 preseason to the 2011 preseason.
In 2010 the preseason touchback rate was 19.5%, and in 2011 it doubled to 39.4%. That equates to a 24.8% reduction in returnable kicks (60.6% / 80.5% = 75.2%). The NFL can expect a proportional reduction in injuries on kickoffs, reducing the rate from 2.0% to 1.5%. (We'll plan to revisit the actual numbers later this season.)
But what does this mean in real terms? How many injuries will this prevent?
In 2010, there were about 9.5 kickoffs per game, which is consistent with the previous 10 years. So reducing the injury rate by half a percent won't add up to much. Instead of the 51 kickoff injuries in 2010, we might expect about 38 in 2011. Thirteen fewer injuries over 32 teams and 267 games from week one through the Super Bowl. That's a reduction of 0.024 injuries per team per game--imperceptibly small and meaningless in practical terms.
Again, not all injuries are reported in the play-by-play. But even if we stipulate that this estimate is an entire order of magnitude too small, that's still only 0.2 fewer injuries per team per game!
Further, looking back at the graph above, it appears that over the past few years, injury rates on kickoffs are in line with those on run and pass plays. In fact, in 2008 and 2009 the kickoff injury rates were lower than for typical scrimmage plays. Getting rid of the two-minute warning in the first half, a gimmick that only allows extra commercials, would have a similar injury-reducing effect just by reducing the number of pass and run plays.
In my mind, this miniscule reduction in injuries does not justify ruining one of the more exciting plays in the game. The trade off just isn't wise--there are better ways to address injury reduction. Even if the kickoff injuries are significantly reduced this season, whatever factors have been causing injuries in general to increase remain unaddressed. Those are the things the league needs to fix, or else injury rates will be back on the climb.
As it stands today, the entire NFL post-score kabuki dance is unwatchable. First there's an automatic review that could take up to several minutes featuring two beer and two car commercials. Then there's the virtually automatic extra point, the NFL's version of...well, I can't think of anything else in the universe so pointless. Now throw in the touchback, followed by Dennis Leary hocking Ford F150s and a positively terrifying ad for some horror/sado-torture movie that gives every kid under 13 nightmares for the next week, plus one for Cialis and one for whatever lame hour-long drama featuring a tough-cookie hot single mom NYPD detective is going to be cancelled on CBS later this fall. Then it's back to some moron sideline reporter who tells us something we either already knew or could just as easily be relayed through the booth announcers. Then, finally, it's back to the game."
I never believed that the Special Teams plays were the most exciting plays in football nor do I agree that a penalty shot is the most exciting thing in hockey. The essence of football is plays from the line of scrimmage. Special Teams arose simply because teams needed a method to transfer possession from one team to another. I would be in favor of eliminating Special Teams from the game if it significantly reduced the amount of injuries in football. However, it would not. Changes in rules need to address how these injuries are happening. If the problem is head and neck injuries change the rules to protect the head and neck. If the issue is leg injuries changes the rules to protect players legs. Implement spacing rules on the line, ban double teams, slide blocks and all cutting. Finally develop equipment to address the root cause of injuries. I have not seen research on it, but I have often heard that switching to soft shelled helmets and pads would reduce the impact and therefore the injuries in football.
Friday, November 4, 2011
Why NFL teams punt on fourth down instead of going for it.
I must admit the reasons why NFL teams punt on fourth down as opposed to going for it is not a question I have ever look at analytically. For football I become emotional in my desires and decision making. I am an old, and never very good, lineman I want to always go for it on fourth down, and I want to run the ball so I can tee up on somebody. Oddly it appears that coaches make the decision on weather to punt based on their own rules which do not have a relation to an analysis of what options have the best expected outcome.
Dr. Rangaraj Ramanuja talked about this on the radio this morning on academicminute.org. Here is a text of the Radio spot:
We all know that fourth-down plays in football games can make for drama. They are also great occasions for observing organizational decision making. This was the premise that got David Lehman at National University of Singapore, other colleagues, and I interested in the question when are NFL teams more likely to go for it on a fourth-down?
To answer this, we analyzed over 22,000 fourth-down plays from regular season NFL games. Our basic findings: teams rarely go for it. In fact, they went for it in just under 12% of the plays. They were more likely to go for it when they were trailing. Trailing teams were much more likely to go for it later rather than earlier in the game.
As observations about football, none of this is surprising. But as statements about decisions in business organizations, they are quite revealing. The finding that teams chose to punt the ball 88% of the time is significant because as several studies of NFL teams have indicated, purely from a risk-benefit viewpoint, teams should be going for it much more frequently. That they don't supports an important idea in organizational sociology that decisions in organizations are often rule-based actions.
In other words, people make choices not by calculating costs and benefits but by choosing appropriate rules to follow. So, for football teams, the rule seems to be that if it is a fourth-down, punt. This also means that the willingness to go for it is essentially the willingness to deviate from a rule or experiment with non-routine actions. Applied to business organizations that pursue the goal of meeting or beating analysts' expectations at the end of each quarter, our findings suggest that such organizations may be more willing to try something different when they are underperforming and when they are close to an important deadline such as the end of the quarter. (from WAMC)
There is a lot here from an analytics and human perspective.
First, it shows me that humans and the organizations they build are risk averse. They choose to protect against the downside (punt) rather than try for the upside (go for it). Most of the people I work with fall out of that spectrum because in order to do startups one simply can not be risk averse. These guys would go for it on fourthand goal from their own one yard line.
From an analytics prospective the are two areas of great concern. First, people often choose to ignore the finding and recommendation of the Data Scientist. I am all for questioning of an analytical study to determine if it is in fact valid, but after that has been done let the data and analytics speak for themselves and respect their findings. Second organizations usually question what they are doing only when they are doing poorly, and only then do they accept change. Imagine what we could achieve if we were willing to constantly look at better ways to do things, and adopt those things that really were. We could be so much better than we are today.
Thursday, November 3, 2011
If you are going to buy one Rstats book this year buy Parallel R
O'Reilly Media just Released Parallel R by Q. Ethan McCallum and Steve Weston. Here is the blurb from their website about the book and the authors:
Parallel R
R is a wonderful thing, indeed: in recent years this free, open-source product has become a popular toolkit for statistical analysis and programming. Two of R's limitations -- that it is single-threaded and memory-bound -- become especially troublesome in the current era of large-scale data analysis. It's possible to break past these boundaries by putting R on the parallel path. Parallel R will describe how to give R parallel muscle. Coverage will include stalwarts such as snow and multicore, and also newer techniques such as Hadoop and Amazon's cloud computing platform.
Authors
Wednesday, November 2, 2011
Does Voter Redistricting have to mean Gerrymandering?
I was listening to the Radio on the way into work this morning, and they were reporting that the Texas redistricting plan was going to be challenged in federal court. The issue in this case seems be that the dominate party in Texas drew the lines of the districts so to work in their favor. The basis for the complaint seems to be that a minority group is not a majority in any of the districts. I am pretty sure there is really no "fair" way to draw a line on a map, and I absolutely sure there is no way to ever draw those districts to satisfy the desires of everyone. However, I also believe having politicians drawing these line is like having the foxes guarding the hen house. We have even come up with a term for the redistricting efforts of politicians. We call it Gerrymandering.
It got me to thinking that there must be a basic model out there to do redistricting that would take the control out of the hands of the politicians and not send their proposals to Federal Court at significant taxpayer expense. It turns out there are, and I will repost two of them here:
Thanks RangeVoting.org
See high-precision computer-generated pictures for all 50 states.
Great. Now compare with our approximate sketch (png fastest) (tiff second best) (pdf third) (ps) of how they'd instead look as drawn by our completely bias-free automatic splitting algorithm.
Arizona's 8 congressional districts (pdf; as they were in 2004) Yes! We have a new champion for most incredible gerrymander: district 2.
Great. Now compare with our approximate sketch (png fastest) (tiff second best) (pdf) (ps) of how they'd instead look as drawn by our algorithm.
North Carolina's 13 congressional districts (pdf; as they were in 2004); love that district 12, and hello, district 3 actually is divided into two or three pieces since it goes out to sea and comes back to land! Or maybe two of them are connected at low tide? (Was that what Paul Revere had in mind when he said "one if by land, two if by sea"?) And ooh, check district 1!
Great. Now compare with our approximate sketch (png fastest) (tiff second best) (pdf) (ps) of how they'd instead look as drawn by our algorithm.
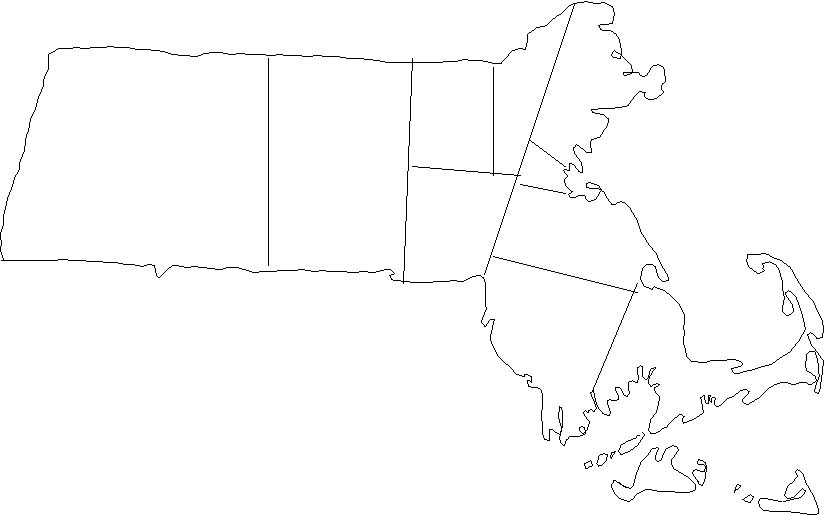
Massachusetts''s 10 congressional districts (map from Adam Carr's Psephos archive) (gif fastest) (png middle) (jpg slowest) versus approximate sketch of how it would look redrawn with our algorithm: (png fastest) (jpg slower) It was Massachusetts governor Elbridge Gerry who is credited with inventing gerrymandering in 1812. He was voted out of office immediately by outraged voters, but his legacy evidently lives on. Massachusetts has 100% Democratic congressmen and has for at least the last three election cycles, despite having a Republican governor (you can't gerrymander the governor race, since it is a statewide election). Here's a Boston Globe Editorial on the subject.
Texas's 32 congressional districts (side-by-side comparative chart from the Associated Press as printed in the Houston Chronicle 9 Oct. 2003) showing district shapes before and after the extraordinary redistricting in 2003. (jpg) (And here [png] is a closeup on what they did to Austin to split up those annoying Austin voters.) The gerrymandering was not inconsiderable before the redistricting, e.g. check district 4 near Dallas. But, after it – after it – aaah, for total statewide brazenness Texas really takes the cake. Check district 19 (Lubbock in the north West) and the whole East half of the state is made of those long thin districts. And for extra amazement check those closeups on Houston, and Tom DeLay's personal district 22. Yup, definitely Texas is an unbelievable new champion. (Check the 127-page Texas Court decision declaring this totally legal. Before re-gerrying: Texas had 17 Democrat and 15 Republican congress. After, it was 11-to-21 the other way. Christian Science Monitor editorial on this.)
(You can make your own sketch of what Texas would look like with the new scheme. Have fun. Much nicer, no?)
Maryland's 8 congressional districts (gif; as they were in 2004). Holy sea of rattlesnakes Batman! Numerous go out to sea and come back to land districts, amazingly squirelly boundary shapes. Here's approximately how it would look redistricted via shortest splitline (png).
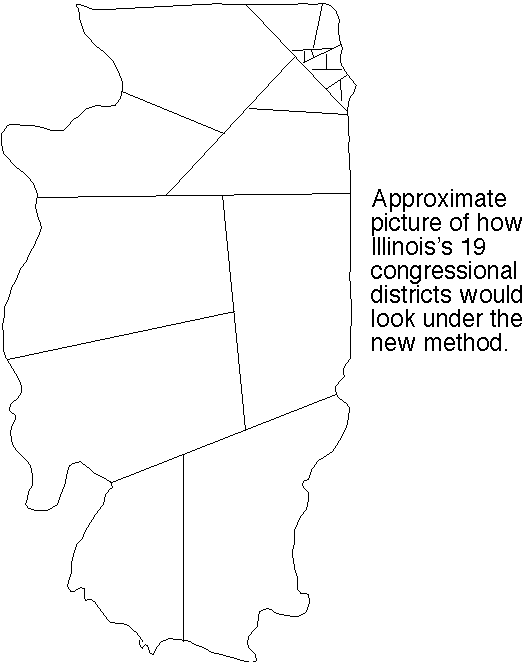
Illinois' 19 congressional districts (pdf; as they were in 2004). Wow. I thought Texas was bad, but Illinois may be the new champ. District 17 is just awesome. But then again districts 19, 15, and 11 are no slouches. You cannot actually see a lot of the small Chicago districts without a magnifying glass, so here is a closeup view (gif) [this picture is from Adam Carr's psephos database] color coded by party control in 2004. Districts 1, 10, 8, 5, and 7 are pretty bad, but district 4 is a wowser! (Notice it looks pretty bad... but then you realize it actually continues west past the point you thought it had ended... going along a thin strip lying entirely inside a highway... which loops around until expanding to enclose a second bad-looking region.)
Great. Now compare with our approximate sketch (png fastest) (tiff second best) (pdf) (ps) of how they'd instead look as drawn by our algorithm.
California? In 2004, not one of CA's 173 state legislative and federal congressional seats changed party-hands. In 2002, every incumbent won re-election, on average with 69% of the vote. California may be the new gerrymandering champion, perhaps even worse than Illinois and Texas, but unlike them its gerrymandering is "bipartisan" that is, arranged by agreement among the Democrats and Republicans to "design their own districts" to make every office holder "safe." (Later note: see this about the new random-commission system CA adopted in 2010-2011!) ( Specifically, CA state law causes any redistricting not approved by at least 2/3 of the state legislature to be challengeable by the voters in a referendum. That forces the Democrats in control of California to gerrymander for at least some Republican legislators too. Republican Assemblyman Roy Ashburn, vice-chair of the redistricting committe, told the San Diego Union-Tribune in May 20-01 "I think it is very possible... we can achieve a bipartisan redistricting... it takes openness and willingness to compromise." And indeed the deal that was struck was to protect almost all incumbents from both parties, allowing Democrats to keep all their seats but also the Republicans could do so, plus the Democrats would draw one new district – mandated by population growth – in such a way that they would get that new one too. Only a few were troubled by the result, e.g. Republican Assemblyman Tim Leslie told the LA Times "We won't have to worry about elections for six, eight, ten years because [the districts] are all pre-set. Everybody wins... What happened to drawing lines for the people of the state rather than ourselves?" ) The devil's jigsaw puzzle (gifs from Adam Carr's psephos database): Northern Calif, Calif Bay Area, Central Calif, Los Angeles area, Southern Calif. All of Los Angeles is amazing but district 53 in Southern Calif. (San Diego) is especially neat since it actually goes out to sea and comes back to land.
Florida? Holy cow, Florida (especially Eastern) may be even worse than California! (color pdf), (Northern FL, gif from Psephos), (Southern FL, gif from Psephos with closeups). The district 22 & 23 tandem team is just beyond belief trying to neutralize as many Democrats as possible so that Florida as a whole can be safely massively Republican-dominated; you really need the closeup map to see its full glory. [Alcee Hastings, an impeached Federal judge convicted of multiple counts of bribery, was re-elected by the 23rd. Gee, I wonder why.]
Many more US state district maps at Wikipedia (jpgs); Ohio, Massachusetts, Oklahoma, and Pennsylvania all are amazing. And http://www.melissadata.com/lookups/mapCD.asp gives you district maps on demand – but I just tried it for my New York district 1 and it was not a very good drawing.
Colorado? The New York Times found a non-gerrymandered district there and expressed incredulity.
And here's a USA Gerrymandering art gallery (gifs).
The advantage of having a purely mathematical definition of the district shapes is that there is absolutely no room whatsoever for bias or any freedom of choice at all by district drawers. That shuts the gerrymanderers down. Period.
We admit you may pay a small price for this, both financially, and occasionally (in some areas) in convenience. But the financial price is tiny compared to the amount you will save from having a less-corrupt, more democratic government. And actually, considering you'll no longer have to pay an unwanted small army of super-biased nerds to figure out how to draw and print those crazy maps, all lot of money will actually be saved with our scheme. In 2001, California State Democrats paid political consultant Michael Berman $1.36 million to draw the US House district map for California, with incumbent Democratic members of Congress paying him collectively about $600,000. "Twenty thousand is nothing to keep your seat," Democratic Congresswoman Loretta Sanchez told the Orange County Reporter. "I spend $2 million [campaigning] every election. If my colleagues are smart, they'll pay their $20,000 and Michael will draw the district they can win in. Those who have refused to pay? God help them." See chapter 1 of Overton's book for this story. In contrast, our high-res computerized splitline districting computation for all 50 states combined cost us approximately 10 cents worth of electricity and less than 1 day worth of time. And the inconvenience will usually actually be "convenience" because it will be much easier to figure out which district you are in if the maps are simple, as opposed to looking like a salamander-octopus mutant diseased with severe hives.
Cross-country survey – which countries seem the best and the worst as far as gerrymandering is concerned? And how do they do it?
Do "independent" or "bi-partisan" district-drawing commissions work?
The (somewhat related) fraudfactor.com site.
I do not believe that automated algorithms will result in districts that are more palatable than the one politicians draw up. Models are still simply the result human thought and representation and as a result simple and imperfect. It is just that an automated system could be more understandable to the general population and cheaper to use.
I am amazed I have not seen this one on Flowing Data, but here is a YouTube visualization someone did on a clustering redistricting algorithm of PA which I thought looked very cool.
Finally in an ongoing effort to mention Andrew Gelman in every blog post. I am posting to a link to his 1994 paper that basically shows the surprising result that despite the efforts of politicians to screw up the process it works out pretty well in the end, and better than if nothing had changed. Gelman's paper
So there you have a quick flyover from a 1%er of the 99%. Gerrymandering is bad, and automated algorithm have their own flaws but make cool visualizations, and it all works out in the end. ;)
It got me to thinking that there must be a basic model out there to do redistricting that would take the control out of the hands of the politicians and not send their proposals to Federal Court at significant taxpayer expense. It turns out there are, and I will repost two of them here:
Thanks RangeVoting.org
Examples of our unbiased district-drawing algorithm in action / comparisons with gerrymandered districts drawn by politicians
(Executive summary) (Return to main page) (splitlining pictures for all 50 states)Advantages
The advantage of having our simple splitting algorithm draw the congressional districts is obvious. There is one and only one drawing possible given the number of districts wanted, the map of the state, and the distribution of people inside it. Which of those people are Liberal, Conservative, Republican, Democrat, Black, White, Christian, Jewish, polka-dotted, or whatever has absolutely zero effect on the district shapes that come out. So you know the maps are going to be completely unbiased. Get politicians to draw the maps and you know that not only are they going to be completely biased, they are also going to be a heck of a lot more complicated-shaped and they are going to use up a lot of your taxpayer money figuring out how to best-rob you of your vote. Which do you prefer? It has been over 200 years. Isn't it time to make gerrymandering a thing of the past?The shortest-splitline algorithm for drawing N congressional districts (part of our ballot initiative)
Formal recursive formulation- Start with the boundary outline of the state.
- Let N=A+B where A and B are as nearly equal whole numbers as possible.
(For example, 7=4+3. More precisely, A = ⌈N/2⌉, B=⌊N/2⌋.) - Among all possible dividing lines that split the state into two parts with population ratio A:B, choose the shortest. (Notes: since the Earth is round, when we say "line" we more precisely mean "great circle." If there is an exact length-tie for "shortest" then break that tie by using the line closest to North-South orientation, and if it's still a tie, then use the Westernmost of the tied dividing lines. "Length" means distance between the two furthest-apart points on the line, that both lie within the district being split.)
- We now have two hemi-states, each to contain a specified number (namely A and B) of districts. Handle them recursively via the same splitting procedure.
See high-precision computer-generated pictures for all 50 states.
Compare the pictures
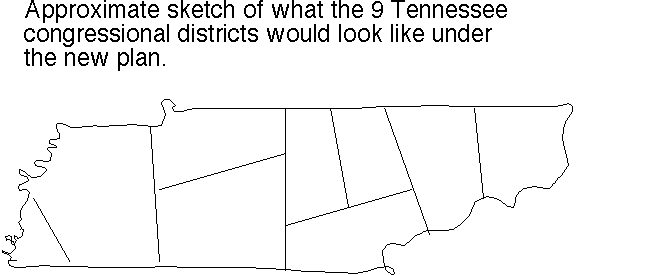
Tennessee's 9 congressional districts (pdf; as they were in 2004) Don't you love the incredibly gerrymandered shapes of districts 3 and 7? (No House member from Tennessee ever lost a bid for re-election during 1980-2005.)Great. Now compare with our approximate sketch (png fastest) (tiff second best) (pdf third) (ps) of how they'd instead look as drawn by our completely bias-free automatic splitting algorithm.
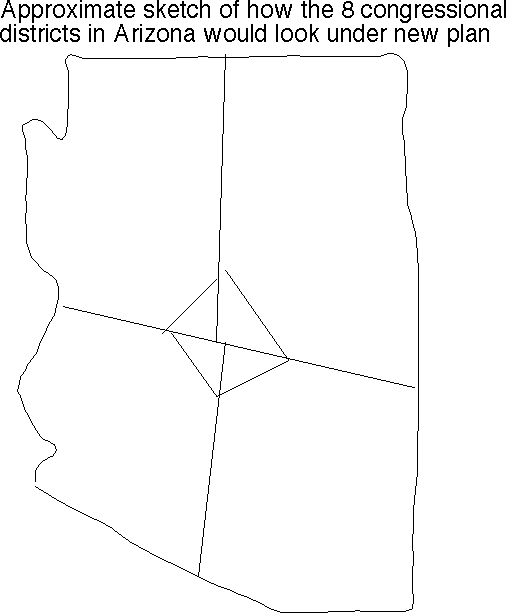
Arizona's 8 congressional districts (pdf; as they were in 2004) Yes! We have a new champion for most incredible gerrymander: district 2.
Great. Now compare with our approximate sketch (png fastest) (tiff second best) (pdf) (ps) of how they'd instead look as drawn by our algorithm.
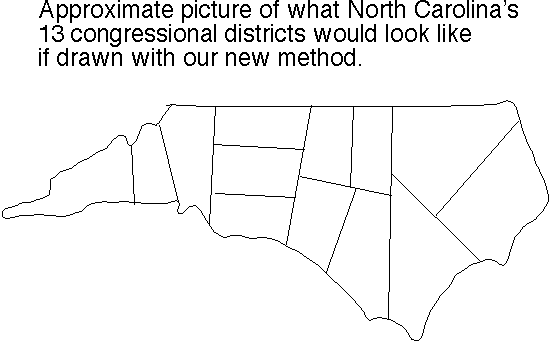
North Carolina's 13 congressional districts (pdf; as they were in 2004); love that district 12, and hello, district 3 actually is divided into two or three pieces since it goes out to sea and comes back to land! Or maybe two of them are connected at low tide? (Was that what Paul Revere had in mind when he said "one if by land, two if by sea"?) And ooh, check district 1!
Great. Now compare with our approximate sketch (png fastest) (tiff second best) (pdf) (ps) of how they'd instead look as drawn by our algorithm.
Massachusetts''s 10 congressional districts (map from Adam Carr's Psephos archive) (gif fastest) (png middle) (jpg slowest) versus approximate sketch of how it would look redrawn with our algorithm: (png fastest) (jpg slower) It was Massachusetts governor Elbridge Gerry who is credited with inventing gerrymandering in 1812. He was voted out of office immediately by outraged voters, but his legacy evidently lives on. Massachusetts has 100% Democratic congressmen and has for at least the last three election cycles, despite having a Republican governor (you can't gerrymander the governor race, since it is a statewide election). Here's a Boston Globe Editorial on the subject.
Texas's 32 congressional districts (side-by-side comparative chart from the Associated Press as printed in the Houston Chronicle 9 Oct. 2003) showing district shapes before and after the extraordinary redistricting in 2003. (jpg) (And here [png] is a closeup on what they did to Austin to split up those annoying Austin voters.) The gerrymandering was not inconsiderable before the redistricting, e.g. check district 4 near Dallas. But, after it – after it – aaah, for total statewide brazenness Texas really takes the cake. Check district 19 (Lubbock in the north West) and the whole East half of the state is made of those long thin districts. And for extra amazement check those closeups on Houston, and Tom DeLay's personal district 22. Yup, definitely Texas is an unbelievable new champion. (Check the 127-page Texas Court decision declaring this totally legal. Before re-gerrying: Texas had 17 Democrat and 15 Republican congress. After, it was 11-to-21 the other way. Christian Science Monitor editorial on this.)
![here [png]](http://rangevoting.org/TXtravis24.png)
(You can make your own sketch of what Texas would look like with the new scheme. Have fun. Much nicer, no?)
Maryland's 8 congressional districts (gif; as they were in 2004). Holy sea of rattlesnakes Batman! Numerous go out to sea and come back to land districts, amazingly squirelly boundary shapes. Here's approximately how it would look redistricted via shortest splitline (png).
Illinois' 19 congressional districts (pdf; as they were in 2004). Wow. I thought Texas was bad, but Illinois may be the new champ. District 17 is just awesome. But then again districts 19, 15, and 11 are no slouches. You cannot actually see a lot of the small Chicago districts without a magnifying glass, so here is a closeup view (gif) [this picture is from Adam Carr's psephos database] color coded by party control in 2004. Districts 1, 10, 8, 5, and 7 are pretty bad, but district 4 is a wowser! (Notice it looks pretty bad... but then you realize it actually continues west past the point you thought it had ended... going along a thin strip lying entirely inside a highway... which loops around until expanding to enclose a second bad-looking region.)
Great. Now compare with our approximate sketch (png fastest) (tiff second best) (pdf) (ps) of how they'd instead look as drawn by our algorithm.
California? In 2004, not one of CA's 173 state legislative and federal congressional seats changed party-hands. In 2002, every incumbent won re-election, on average with 69% of the vote. California may be the new gerrymandering champion, perhaps even worse than Illinois and Texas, but unlike them its gerrymandering is "bipartisan" that is, arranged by agreement among the Democrats and Republicans to "design their own districts" to make every office holder "safe." (Later note: see this about the new random-commission system CA adopted in 2010-2011!) ( Specifically, CA state law causes any redistricting not approved by at least 2/3 of the state legislature to be challengeable by the voters in a referendum. That forces the Democrats in control of California to gerrymander for at least some Republican legislators too. Republican Assemblyman Roy Ashburn, vice-chair of the redistricting committe, told the San Diego Union-Tribune in May 20-01 "I think it is very possible... we can achieve a bipartisan redistricting... it takes openness and willingness to compromise." And indeed the deal that was struck was to protect almost all incumbents from both parties, allowing Democrats to keep all their seats but also the Republicans could do so, plus the Democrats would draw one new district – mandated by population growth – in such a way that they would get that new one too. Only a few were troubled by the result, e.g. Republican Assemblyman Tim Leslie told the LA Times "We won't have to worry about elections for six, eight, ten years because [the districts] are all pre-set. Everybody wins... What happened to drawing lines for the people of the state rather than ourselves?" ) The devil's jigsaw puzzle (gifs from Adam Carr's psephos database): Northern Calif, Calif Bay Area, Central Calif, Los Angeles area, Southern Calif. All of Los Angeles is amazing but district 53 in Southern Calif. (San Diego) is especially neat since it actually goes out to sea and comes back to land.
Florida? Holy cow, Florida (especially Eastern) may be even worse than California! (color pdf), (Northern FL, gif from Psephos), (Southern FL, gif from Psephos with closeups). The district 22 & 23 tandem team is just beyond belief trying to neutralize as many Democrats as possible so that Florida as a whole can be safely massively Republican-dominated; you really need the closeup map to see its full glory. [Alcee Hastings, an impeached Federal judge convicted of multiple counts of bribery, was re-elected by the 23rd. Gee, I wonder why.]
Many more US state district maps at Wikipedia (jpgs); Ohio, Massachusetts, Oklahoma, and Pennsylvania all are amazing. And http://www.melissadata.com/lookups/mapCD.asp gives you district maps on demand – but I just tried it for my New York district 1 and it was not a very good drawing.
Colorado? The New York Times found a non-gerrymandered district there and expressed incredulity.
And here's a USA Gerrymandering art gallery (gifs).
"There is no issue that is more sensitive to politicians of all colors and ideological persuasions than redistricting. It will determine who wins and loses for eight years." – Ted Harrington, political science chair, UNC-Charlotte, quoted during Shaw v. Hunt trial, March 1994
Only two things are infinite, the universe and human stupidity, and I'm not sure about the former. – Albert Einstein
Does our redistricting method have any disadvantages?
Yes, but they are tiny compared to its benefits. Our district shapes ignore geographic features such as rivers and highways, and political features such as country boundaries inside state maps. As you can see from the example-pictures above, the old approach of politicians drawing districts sometimes used those things, sometimes misused them, and other times conveniently ignored them, all with the principal aim of maximally denying you fair representation.The advantage of having a purely mathematical definition of the district shapes is that there is absolutely no room whatsoever for bias or any freedom of choice at all by district drawers. That shuts the gerrymanderers down. Period.
We admit you may pay a small price for this, both financially, and occasionally (in some areas) in convenience. But the financial price is tiny compared to the amount you will save from having a less-corrupt, more democratic government. And actually, considering you'll no longer have to pay an unwanted small army of super-biased nerds to figure out how to draw and print those crazy maps, all lot of money will actually be saved with our scheme. In 2001, California State Democrats paid political consultant Michael Berman $1.36 million to draw the US House district map for California, with incumbent Democratic members of Congress paying him collectively about $600,000. "Twenty thousand is nothing to keep your seat," Democratic Congresswoman Loretta Sanchez told the Orange County Reporter. "I spend $2 million [campaigning] every election. If my colleagues are smart, they'll pay their $20,000 and Michael will draw the district they can win in. Those who have refused to pay? God help them." See chapter 1 of Overton's book for this story. In contrast, our high-res computerized splitline districting computation for all 50 states combined cost us approximately 10 cents worth of electricity and less than 1 day worth of time. And the inconvenience will usually actually be "convenience" because it will be much easier to figure out which district you are in if the maps are simple, as opposed to looking like a salamander-octopus mutant diseased with severe hives.
Find out more
Gerrymandering can lead to self-reinforcing one party domination.Cross-country survey – which countries seem the best and the worst as far as gerrymandering is concerned? And how do they do it?
Do "independent" or "bi-partisan" district-drawing commissions work?
The (somewhat related) fraudfactor.com site.
I do not believe that automated algorithms will result in districts that are more palatable than the one politicians draw up. Models are still simply the result human thought and representation and as a result simple and imperfect. It is just that an automated system could be more understandable to the general population and cheaper to use.
I am amazed I have not seen this one on Flowing Data, but here is a YouTube visualization someone did on a clustering redistricting algorithm of PA which I thought looked very cool.
Finally in an ongoing effort to mention Andrew Gelman in every blog post. I am posting to a link to his 1994 paper that basically shows the surprising result that despite the efforts of politicians to screw up the process it works out pretty well in the end, and better than if nothing had changed. Gelman's paper
So there you have a quick flyover from a 1%er of the 99%. Gerrymandering is bad, and automated algorithm have their own flaws but make cool visualizations, and it all works out in the end. ;)
Tuesday, November 1, 2011
R 2.14 is release and R 2.15 is now a year away.....
I missed this yesterday because I was out trick or treating, but R 2.14 was released. I love that on CRAN it is called R 2.14.0 ( Great Pumpkin). Here is the link to download it now.
David Smith did a nice summary of what 2.14.0 on his Revolutions Blog which I have copied here:
As scheduled, the first release of the new R 2.14 series is now available for download in source code form. As of this writing, pre-compiled binaries for Windows, Linux and MacOS aren't yet available, but will appear on your local CRAN mirror in the next couple of days.
One of the biggest changes in 2.14 is the introduction of the new "parallel" package as a standard part of R. As the NEWS file explains:
Other improvements include better alignment of math and text in graphics, Rao's efficient score test for GLM's, the ability to draw curves from functions with plot.function, a new L'Ecuyer random number generator, improved access to documentation (especially vignettes), and several minor bug-fixes.
With R now on an annual (rather than six-monthly) update cycle, R 2.15 is not expected until October 2012 (with point releases for the 2.14.x series likely in the interim).
Thanks David.
2.14.0 continues the trend to incorporate performance enhancements into base R. Parallel packages have long existed for R, but this addition to base R is a nice touch as is the byte-compiling. I believe the changing to an annual release schedule is also a great idea that will work better with the commercial customers than the current system of six month cycles. Most of the commercial R users that I have dealt with update on an annual basis and would choose to update on the odd or even numbered revisions. This meshing of the updates will help those commercial users out a great deal.
David Smith did a nice summary of what 2.14.0 on his Revolutions Blog which I have copied here:
As scheduled, the first release of the new R 2.14 series is now available for download in source code form. As of this writing, pre-compiled binaries for Windows, Linux and MacOS aren't yet available, but will appear on your local CRAN mirror in the next couple of days.
One of the biggest changes in 2.14 is the introduction of the new "parallel" package as a standard part of R. As the NEWS file explains:
[The parallel package] incorporates (slightly revised) copies of packages multicore and snow (excluding MPI, PVM and NWS clusters). Code written to use the higher-level API functions in those packages should work unchanged (apart from changing any references to their namespaces to a reference to parallel, and links explicitly to multicore or snow on help pages).In addition, all of the standard (base and recommended) R packages are now byte-compiled on installation, which improves R's performance in several situations.
Other improvements include better alignment of math and text in graphics, Rao's efficient score test for GLM's, the ability to draw curves from functions with plot.function, a new L'Ecuyer random number generator, improved access to documentation (especially vignettes), and several minor bug-fixes.
With R now on an annual (rather than six-monthly) update cycle, R 2.15 is not expected until October 2012 (with point releases for the 2.14.x series likely in the interim).
Thanks David.
2.14.0 continues the trend to incorporate performance enhancements into base R. Parallel packages have long existed for R, but this addition to base R is a nice touch as is the byte-compiling. I believe the changing to an annual release schedule is also a great idea that will work better with the commercial customers than the current system of six month cycles. Most of the commercial R users that I have dealt with update on an annual basis and would choose to update on the odd or even numbered revisions. This meshing of the updates will help those commercial users out a great deal.
Monday, October 31, 2011
Halloween is for Brain Teasers and Paradoxes
In the last few weeks quite a few people have done postings on brain teasers so I thought I would post a bunch of them here.
IQ Test --Solve it-" Pure Logic test from Harvard University If: 1 = 5, 2 = 25, 3 = 325, 4 = 4325, 5 = ?
(Thanks Vijay Kumar)
If you choose an answer to this question at random, what is the chance you will be correct?
A) 25%
B) 50%
C) 60%
D) 25%
(Thanks Nathan of Flowing Data)
If you have three light switches in one room that each turn on one lamp in another room, and you can only enter the room with the lamps once how do you determine which switch goes to which lamp?
Good video on the Monte Hall Problem ( although I would stay with the first door because I already have a car, but I could use a goat)
Finally here is a cool website of Riddles and Brain Teasers
If you have any other ones that you like send them to me and I will add them.
Thursday, October 27, 2011
Is there really a Data Scientist shortage or are we victims of our own Predictive Analytics?
Recently I have gone to a number of conventions like Strata NYC and Predictive Analytics World NYC. I heard the same call over and over. There is a storage of Data Scientists! It is going to get worse! We need another 190,00 Data Scientists just to fill the need! For those of you who do not know what a Data Scientist is, Mike Driscoll describes it on Quora as a blend of Red-Bull-Fueled Hacking and espresso-inspired statistics. Awesome!
I started to wonder where this number came from, and how it was developed. Why? Well, I am a Data Scientist of sorts, and I am not confident there is a real shortage of people who do this work or who can do this work. It also raises my alarm bells when I see the same presentations by different people that present the same numbers. The chance of so many people coming to exact the same numbers independently is about as likely as five people in the US dying by drink tap water ( the same chance as winning Powerball). I did a project to estimate the number of R users in 2006 at a Subway on a napkin that was re-used by countless people over the next couple of years. Thank god others have taken a more detailed look at that issue since, and people now use their numbers.
Turns out the 190,000 number comes from McKinsey Global Institute which projects the shortfall by 2018. When I found that out, I really began to question the number which had already been misquoted in most of the presentations I had seen. Some presentation had even presented the 190,000 person shortfall as a current condition rather than a projection for 2018. The term Data Scientist was first coined by Jeff Hammerbacker at Facebook in 2007. I am leary of a projection seven years out for a position that was not even named until four years ago. Reminds me of Morris's paper to predict batting averages for the season for MLB batters using their first 40 at bats. Not a very useful training set.
While I was writing this I was sent a post from Andrew Gelman's blog. I am a firm believer that no statistics blog post is complete without an Andrew Gelman quote or post so here it is: The #1 way to lie with statistics is...to just lie . Do not read anything into the coincidence of the quote with this post, but the timing is surprising. Besides it is a good warning to us all to let the data speak for itself, and not try to support our own opinions through use of statistics or lack thereof.
Now to the Mckinsey Report. If you are dying to read all 156 pages of the report here is the link: McKinsey Big Data Report. You will need the Red Bulls and Espressos that Mike Driscoll mentioned earlier! I will save you the time. Mckinsey talks about how they can to that number on page 134 in the appendix. I see a lot of problems. First there is no data or sample data, and there is no description of the predictive model used. Without the means to attempt to validate, I have to question if the conclusion is valid. In their brief description of what they did to come up with these numbers I already see problems. Mckinsey says their raw data is based on SOC code numbers from 2008. That is one year after the term data scientist was coined and what is required to be one has changed quite a bit sense then. A static description of a moving target may be a highly inaccurate. Second, they list the SOC codes they used to determine their population. I see an number of SOC code that Data scientists come from that are missing from the start. The most glaring one is physicist. Some of the best Data scientist in the field are physicists and there are a lot of them in the field.
Looks like we need to get a Data Scientist to look at how many Data Scientists were are going to need in the future.
Wednesday, October 26, 2011
Vegas Odds for Worlds Series Champions 2011 at start of MLB playoffs
It is always fun to look back with knowledge and laugh at how off the odd makers were because we always knew better. The 2011 MLB playoff have been a shinning example of this with the teams given a 8-to-1 and a 12-to-1 chance vying for the title of World Series Champions.
Yes, few believed the Texas Rangers could became Champions having to compete against American league foes of the likes of the New York Yankees (4-to-1), Tampa Bay Rays (9-to-1) and Detroit Tigers (7-to-1). Yet they did.
Fewer still believed the St. Louis Cardinals had any hope against powerhouse teams like the Phillies (9-to-5), Brewers (15-to-2) and Diamondbacks (14-to-1). That is why they play the games.
With all teams being equal the chance of any two particular teams being in the World Series is only about 6% which is a rare event to begin with. However weighting your brackets with vegas odd usually improves on that. Not this year. Payoff numbers mess it up a little, but the odds makers thought the chances of a St. Louis versus Texas World Series was about 2%. So enjoy the rarity.
Tuesday, October 25, 2011
Some Great R Users Meetups are coming up
If only I had a ton of frequent flier miles I would go to them all. However, I am running a little low so I won't be able to go to them all. Here are the ones that I think will be awesome:
Nov 3 (NYC Predictive Analytics) Hidden Markov Models in a Nutshell
Description: Hidden Markov Models (HMMs) have emerged as a powerful paradigm for modeling stochastic processes and pattern sequences. Originally, HMMs have been applied to the domain of speech recognition, and became the dominating technology. In recent years, they have attracted growing interest in automatic target detection and classification, computational molecular biology, bioinformatics, computational finance, mine detection, handwritten character/word recognition, and other computer vision applications. The purpose of this talk is to define HMM and its categories, present the corresponding underlying problems, and explain the step-by-step working of the most popular procedure for HMM parameter estimation: Baum-Welch algorithm.
This group is one of my favorite groups to go to, and any time there is a talk on Markov I am there.
Nov 8 ( NYC R Meetup) Parallel R with Hadoop
Nov 10 (Greater Boston R users) Teaching Statistics with Open Source Tools
Nov 14 (DC R User Group) Moneyball Meets R: Sabermetrics with the MLB Pitch Data Set by Mike Driscoll
Nov 3 (NYC Predictive Analytics) Hidden Markov Models in a Nutshell
Description: Hidden Markov Models (HMMs) have emerged as a powerful paradigm for modeling stochastic processes and pattern sequences. Originally, HMMs have been applied to the domain of speech recognition, and became the dominating technology. In recent years, they have attracted growing interest in automatic target detection and classification, computational molecular biology, bioinformatics, computational finance, mine detection, handwritten character/word recognition, and other computer vision applications. The purpose of this talk is to define HMM and its categories, present the corresponding underlying problems, and explain the step-by-step working of the most popular procedure for HMM parameter estimation: Baum-Welch algorithm.
Bio: Oualid Missaoui is researcher with Pipeline Financial Group, Inc. where he is in charge of developing data mining and pattern recognition based algorithmic trading framework. He received his Ph.D. in Computer Engineering & Science for his research in the fields of machine learning, landmine detection, and image processing, from University of Louisville (2010). He earned his engineering degree in Signal and Systems and M.Sc. in Applied Mathematics from Ecole Polytechnique de Tunisie (2003, 2005).
This group is one of my favorite groups to go to, and any time there is a talk on Markov I am there.
Nov 8 ( NYC R Meetup) Parallel R with Hadoop
R is free, open-source, and in many ways a data scientist's dream ... but it strains under new-age Big Data problems. One solution is to use Hadoop's scalable, parallel computing framework to drive R. In this talk, consultant and author of the forthcoming bookParallel R, Q Ethan McCallum will walk through the what, how, and why of getting R to dance with the elephant.
We will also have a lightning talk from JunHo Cho, who will introduce his tool RHive, which integrates R with Hive.
Q recently co-wrote a book with Steve Weston of Rforeach fame. I am excited to read it when it comes out.
Nov 10 (Greater Boston R users) Teaching Statistics with Open Source Tools
Nicholas Horton, Associate Professor of Mathematics and Statistics at Smith College, will be presenting on how to ease the use of R in an academic environment. This talk is hosted by Gordon College and we know it is a bit out of town (and early in the day for some), but we hope you can attend. It will be a great talk for beginner R users or those who haven't made the switch to R, but want to!
Summary: Professor Horton will demonstrate the use of the mosaic package, which was created with instructors and students in mind, and to help facilitate the use of modeling in introductory statistics, science and calculus courses. He'll give an overview of these systems for use in introductory statistics courses and undergraduate research projects. No prior experience with R or the mosaic package necessary. Minor refreshments will be provided.
I am always interested in how people approach things with steep learning curves.
Nov 14 (DC R User Group) Moneyball Meets R: Sabermetrics with the MLB Pitch Data Set by Mike Driscoll
For our next meetup we'll have some fun with Mike Driscoll (fellow Data and R Geek, organizer of the Bay Area R meetup group, CTO of MetaMarkets, O'Reilly Strata/OSCON speaker, and author of the"The Three Sexy Skills of Data Geeks" blog post) while he talks about the validation of Bill James’ sabermetrics approach to batting performance using 30 years of Major League Baseball statistics, and a derived predictor for batters’ salaries using R.
He will highlight R’s functional programming features, its compact syntax for statistical modeling, and its ease of connectivity with persistent data stores. This talk will emphasize techniques and approach over detail.
I am a huge sabermetrics and Mike Driscoll fan. I saw Mike speak most recently at Strata NYC where he probably skipped the sabermetrics stuff because both the Mets and Yankees were already out of it.
Nov 15 (Boston Predictive Analytics) Big Data and Hadoop: Applications from Enterprises and Individuals
7:00 - 7:30: Enterprise Case Studies: Rob Lancaster and Patrick Angeles of Cloudera, a company which provides enterprise solutions that extends upon Hadoop functionality, will be presenting a high-level overview of big data and associated applications. Secondly, they will be presenting a variety of "use cases" including diving into technical details of Hadoop and related software.
7:30 - 8:00: "Open Data" Project: Satish Gopalakrishnan and Vineet Manohar will be presenting their Wikipedia / Hadoop project which they created as part of the Hack/Reduce event this past summer at Microsoft NERD. Their computer program was voted the coolest hack using Hadoop with open data.
6:30 - 6:50: Overview of Big Data and Hadoop: Jeffrey Kelly, who is an industry analyst covering Big Data, will be presenting the state of the industry. In addition to early adopting web-based companies, he will be covering a variety of "use cases" that are now occurring across more industry verticals.
6:50 - 7:00: Web/Mobile and Big Data: Sanjay Vakil, who is a technology manager at Trip Advisor, will be presenting past and current Big Data projects that their team have been developing.
7:00 - 7:30: Enterprise Case Studies: Rob Lancaster and Patrick Angeles of Cloudera, a company which provides enterprise solutions that extends upon Hadoop functionality, will be presenting a high-level overview of big data and associated applications. Secondly, they will be presenting a variety of "use cases" including diving into technical details of Hadoop and related software.
7:30 - 8:00: "Open Data" Project: Satish Gopalakrishnan and Vineet Manohar will be presenting their Wikipedia / Hadoop project which they created as part of the Hack/Reduce event this past summer at Microsoft NERD. Their computer program was voted the coolest hack using Hadoop with open data.
I love this short talk format and Hadoop is the hot buzz word of the year.
Monday, October 24, 2011
St. Louis Cardinals have the formula to beat the Texas Rangers
In most cases pitching wins a series. That is especially true for the World Series. This year the St. Louis Cardinals are in the World Series against the Texas Rangers not because of their pitchers, but because of how they have managed their pitchers. However, in order to beat the bats of the Texas Rangers, the St. Louis Cardinals are going to have to take their approach to pitching to the next logical level. The problem is that tradition will be standing the way.
Baseball has a long tradition of honoring the starting pitcher. In fact the idea of relief pitching is a relatively new concept. These traditions are so deep in baseball that a starting pitcher only earns the win if he pitches five innings while that rule does not always hold true for a reliever. In some cases a starting pitcher's compensation is even tied to the number of wins he has. However, maximizing starting pitchers wins may reduce the overall wins for the team particularly in the St. Louis Cardinals' case.
It has long been known that relief pitchers have an average ERA about .5 better than starting pitching. Often the reasons given for this is that starting pitchers must pace themselves while relievers do not. If pacing themselves results in the better pitcher having worse numbers than the weaker pitcher why is this a good way to play the game? Over the course of the season this difference would account for roughly 80 additional runs being allowed or according to Bill James's Pythagorean expectation 9 fewer wins in a season. That is a significant impact.
Throughout this year's MLB playoff season the St. Louis Cardinals have been most successful when they have used a lot of pitchers for a few innings each in a game. Yes, there is the notable exception of Carpenter's innings which was impressive but not the most likely path to victory.
Below is a quick breakout of the ERA of the Cardinals when their pitch 3 innings or less versus when pitchers ERA in the fourth inning or greater.
Below is a quick breakout of the ERA of the Cardinals when their pitch 3 innings or less versus when pitchers ERA in the fourth inning or greater.
| Series | ERA <=3 Innings | ERA >3 innings |
| STL V PHI | 3.64 | 6.5 |
| STL V MIL | 3.66 | 10.5 |
| STL V TEX | 2.16 | 6.3 |
To me this analysis would indicate the best chance the Cardinals have of winning the World Series is to never pitch a pitcher more than 3 innings against the Texas Rangers.
Thursday, October 20, 2011
The best talk at Predictive Analytics World NYC 2011 happened at night
I have enjoyed my week at Predictive Analytics World in New York. There have been some good talks, but I was missing the samples of code and concrete examples that I am used to from the simply outstanding geek gatherings ( called Meetups) that I go to in New York City all the time.
Professor Jay Emerson, Dr Awesomeness, satisfied that need with a simply outstanding talk last night to around 300 hardy PAWs members who finished off a 14 hour day with Jay's talk. It was worth it.
Jay's talk had everything from humor, to examples, to sample code, to usable advise. I just want to thank Jay again for making the effort to entertain and educate us all.
Link to Dr Jay Emerson's slides
Tuesday, October 18, 2011
Floop, the iPhone polling App, appears on ABC news in advance of Presidential Debates
Today on the ABC News show Topline they did an interview with Richard Schultz on the iPhone polling App, Floop. Why is a Politics show covering Floop? The answer is simple. There is a Presidential Debate in Las Vegas tonight, and what better way to participate in it than with Floop?
When I have watched debates in the past I viewed in disbelief after debates as the talking heads on television totally missed the boat on what just happened, and what was important. The next day is rarely better when the canned polling from people like Quinnipiac University release their polling results that cover topics that are either too broad or uninteresting. Now I do not need them. With Floop I can do my own polls, and see the results from real people in real time. Their opinions are given in both quantitative and textual feedback.
Now is the time for the people take back our government. We will do this by communicating directly with each other on social networks and cutting out the talking heads and spin doctors who tried to shape our opinions in the past. Thomas Jefferson said a little revolution every now and then is good for a democracy. Well a revolution had arrived. An election process truly driven by the people with social networks. Tools like Floop lead the way.
MLB playoffs format gives the worst teams best shot at a World Series title?
I was going through the chat sections of my linkedin groups, and there was a thread there that talked about making the MLB playoff games a best of seven series and the World Series a best of nine series. The argument being that longer series will yield more wins for the superior teams.
I have to admit I never understood why baseball does the playoff to World series the way that they do. First they play a 162 game season to determine the eight best teams which given the number of games there is a high probability they are really the best eight teams. Then they playoff in the first round in a best of five series which gives the weaker team a better shot of winning than a seven games series. Then MLB finishes off the playoff with two rounds of a best of seven. It is an illogical progression.
If the goal is to give the best team the best shot without increasing the number of games in the playoffs the best way to do that would be to make the first two rounds a best of seven series and the World Series a best of five.
To give you an idea of the difference between a best of five series and a best of seven series lets run some numbers. In a typical MLB season the best teams win about 60% of the time while the worst teams win about 40% of the time. Using that as their excepted chance of wining a game, the chances of the weakest team in baseball beating the best team in baseball in a best of five game series is roughly 32% while in a best of seven series that team has roughly a 29% chance of winning. Yup, that is a staggering three percent improvement in the chances the better team wins the series. Interesting to the statistician but irrelevant to the typical baseball fan.
Personally I think the playoffs should be switched to a best of seven series all the way through mostly for uniformity reasons than anything else.
Wednesday, October 12, 2011
Theo Epstein to leave Red Sox for Cubs. Welcome to the new age of Baseball
The rumor is that Theo Epstein, current general manager of the Red Sox, has agreed to a $15M deal to become President and General Manager of the Cubs. This is another step by the Chicago Cubs in building a world class sabermetric based front office in hopes of building a contender on the field. The Chicago cubs already added a major piece to this puzzle last year when they added Statistician Ari Kaplan to the front office. Ari's stuff is brilliant. The first Sabermetric book I ever read was one he co-authored called Baseball Hacks. I like the way the Chicago Cubs are heading here and wish the best of luck to them in the future. Of course, statistically speaking is there really such a thing as luck?
Tuesday, October 11, 2011
Going to Predictive Analytics World NYC for Big Data and Rstats
For the week of October 16th I am going down to NYC to immerse myself in more cool classes, speakers and forums at Predictive Analytics World (PAWs). This conference brings together some of the people whose work I just love, and I know very well in some cases and not at all in others. Below are some of the highlights of the conference in my eyes which follows pretty closely to the talks and class I will be going to.
Max Kuhn, an heavy R user, will be giving an R bootcamp and a predictive analytics in R class. I will be attending at least one of these. Max has created some heavily used R packages including Caret and ODFweave. Every presentation I have seen covering the use of R in analytics competitions like Kaggle.com start with using Max's Caret Package.
Matthew Flynn who is the Director of Claim Research at Travelers in Hartford is giving a talk on creating more analytical bandwidth with R. I believe Travelers is a big SAS user which seems to match up with Matthew's bio so it will be interesting to hear his views on R particularly if it has to do with using the R connector to SAS. However, I am always excited to find another R user in Connecticut! In that light here is an open offer to Matthew or any other R user in Connecticut to join the Connecticut R users meetup, and I promise the first round will be on me.
Anthony Goldbloom, CEO of Kaggle, is giving a talk on Predictive Modeling Competitions. I have been to a number of Anthony's talks, and they are great fun. I have also been to a number of talks by people who have competed in Kaggle competitions, and the approaches and results are simply mind blowing. Kaggle has helped take Predictive Modeling to the next level. It provides a fun environment where Data scientist can push their art and skill against other talented people. Truely great stuff.
Usama Fayyad who is the CTO of ChoozOn is giving a talk on Predictive Analytics and Big Data. Given that Usama was the Chief Data Scientist at Yahoo, and I am sure that he still plays in the REALLY big data pool, I am dying to hear his approaches and views on attacking the various problems.
John Elder of Elder Research is giving a talk on the best and the worst of Predictive Analytics. I love these types of talks. When the mistakes are presented to us they are amusing, but I promise you I will not make those those mistakes in the future because I do not want to be in one of John's talks.
Robert Broughton will be giving a talk on Predictive Analytics and law enforcement. I have seen more on more articles and blog posts on this area in the last year. I believe it has huge potential to reduce crime and make the world a safer place. I am eager to hear this talk.
The are more great speakers that may interest you more than the ones that interest me, but my dance card is full and I am tired of typing so I will just give you the link to the list of speakers.
Wednesday, October 5, 2011
Echoing the call to help Data Without Borders
While the job of the data scientist can include increasing web traffic, clicks, and maximizing revenue. I have always found this area of application to be unsatisfying. When we first formed Revolution Computing our slogan was "we cure cancer". We wanted to run a profitable business, but it was also critical to us that the business result in positive impacts on peoples lives and on society in general. I like to think that the Open Source community and particularly the R community keeps that idea as one of its driving motivations.
At Strata NYC 2011 Robert Kirkpatrick of UN Global Pulse asked for help from the Data Scientist community to make the world a better place, and offered examples of how our community could help the world community.
I enjoyed this talk, but it was a request for help.
On the final day of Strata NYC Drew Conway and Jake Porway launched Data Without Borders and went into action. They are going to run DataDives with some of the best Data Scientists around as volunteers to provide value and insight to NGOs and nonprofits to improve all aspects of their operations. Here is a video of that presentation:
The results so far is an oversubscribed DataDive in NYC and another DataDive in San Francisco filling up fast. That is what I love about this community. They give freely of their time and knowledge to better the world around them. The best people are people of action not words.
Another article on Data Without Borders. It is also good to see that David Smith and Revolution Analytics continues with the idea of supporting efforts for the betterment of society.
Thursday, September 29, 2011
MLB end of the season 2011. Unusual? Momentum in Baseball? Tired?
So as I am trying to recover from lack of sleep because of last night's extra inning and rain delayed MLB games. I am starting to ask a few questions about the last day of the regular season itself.
First was the number of extra inning game unusual? The answer appears to be yes, but not unheard of. About 10% of all MLB baseball games go into extra innings so last night was not really that out of whack. I am still looking into overcoming a seven run deficit to win a game with less than two innings left which I do believe is an extremely rare event.
I also noticed that the both the Rays and the Orioles were the teams that came back late in the game and went on to win. So my knee jerk reaction was that momentum was a major factor in those teams winning the game, Momentum is huge in sports. Then I had a flash back moment and realized that momentum in sports is a popular truism, but a practical myth. Here is the link that talk about the lack of momentum in Baseball.
Either way praise is in order for the Tampa Bay Rays and condolences for the Boston Red Sox. The Sabermetrics guys at Tampa Bay do an amazing job of finding potential on a limited budget, and the Red Sox's analysts like Bill James and Tom Tippett showed them the way. Remember we never fail, but always see ways to improve our prediction
Wednesday, September 28, 2011
An Update on the Floop iPhone App for Polling and Surveys
Floop continues to very well with something in the area of 30,000 downloads so far which is amazing given that it was kind of a stealth launch. In addition to significant downloads and good user traction Floop is starting to get some press. I have posted some of the links below:
Portfolio.com
Gigaom
Appolicious
Overlapps
Portfolio.com
Gigaom
Appolicious
Overlapps
Tuesday, September 27, 2011
The American League Wild Card Race
So the Boston Red Sox and the Tampa Bay Rays are all tied up with one game to play in the regular season. I am a big Sabermetrics fan and the timing of this event with the recent release of Moneyball the movie is ironic, but I believe in the last week I have not looked at a single stat. Instead I watch night after night riding the joyful rollercoaster of emotion. I had forgotten this part of baseball. Dan ducquette once told me to remember to enjoy the game, and this week I have. After the regular season is over and the emotion drains away I will sit down and become the mathematician that I am and try to understand what happened here and why. However, until then I will watch the Red Sox And the Rays play their last games of the season purely for the enjoyment of it.
Monday, September 19, 2011
Strata NYC Jumpstart 2011 wrap up
Today was the first day of Strata NYC 2011 which is a five day Big Data conference in New York. The first day of talks are the so called Jumpstart talks that deal with the issues of Big Data at a very high level. The down side for me on the high level talks is they lose the granularity and coolness of the more detailed analytics talks that I go to. Nonetheless they were good talks given by some very influential thought leaders in the field of analytics and Big Data. Here are some of the highlights:
Nolan Goldberg gave the first talk and potential buzz kill session of the day. Nolan is a lawyer and gave a sweeping overview of the development of the law with respect to big data and privacy. Basically the law and the technical development pace has resulted in a moving target. Solutions that protected people's privacy only a short time ago are no longer capable of doing that. This poses problems for figuring out what is ok, and determining if your solution or application might have a legal problem. Also as the US, individual states and the EU try to address this issue the is no reason to believe they will do this in sync or even come up with a similar end solution. Kind of makes me feel like I am flying without a net, but at least Nolan was honest about it.
Cathy O'Neil, Hiten Shaw and DJ Patil gave talks about various requirements to hire, utilize and build cultures that are successful with data scientists. I loved their approaches to organizations. I do not care what industry you are in if you empower your people in a positive collaborative environment you will succeed. Simple ideas, but here are three people who followed their own advise and were successful with it.
Simon Wardley gave a talk on the development process of an idea from new to a commodity. Hopefully I can use his thoughts to avoid following my next business from boom to commodity and death. That ride down sucks so I hope Simon's ideas help.
Michael Nelson give great talk on transparency of your data. I liked Mike's take on this. I really enjoyed the idea that we should start by thinking we should share all data instead of we need to protect all data. We have been so paranoid about this issue for so long maybe by starting with the counter argument we will achieve the righ balance.
Talks dealt with the importance of reputation and credibility online. Turns out that is more important today then ever before and a good Data Scientist can put a value on it ( something like 20%).
Overall a good day, although I can not wait until we take a deeper drive.
Friday, September 16, 2011
Slides from the weeks R and Open Statistical Programming Meetups
There were two great meetups this week, and I want to share the slides with everyone.
The first slides are from the R for Beginners session at the Greater Boston Area R Users Group. I am so glad that a useR group finally did this, and that it was well attended. In fact, I think it ws double the usual attendance for this group, and there was a waiting list! Also good to know that they are planning another R for Beginnners session later in the year. Here is a link to the slides
The recently renamed NYC Open Statistical Programming Meetup which is run by the recently married and employed Drew Conway had a talk by Wes McKinney. Wes gave a thought excellent talk on the things he is working on in Python and some thought provoking opinions on both Python and R. That was a brave thing to do since most of those in attendance are primarily R users. I do not personally agree with Wes on some of those opinions, but his presentation has already resulted in a healthy discussion of the issue. Here is a link to the Slides
Thursday, September 15, 2011
R Users Group in Connectict (#rstats)
I am not sure if I am tired of driving to the R User meetups in NYC and Boston or if I want to prove that we can have a great RUG in Connecticut, but I went ahead and formed a group. I set it up on Meetup this morning. I have not set a date, topic or location yet, but as soon as we get enough people I will get that done as well.
Connecticut has a long history with the R language. We formed Revolution Computing ( now Revolution Analytics) in New Haven, and many of the people in New Haven who helped us get off the ground were avid R users and contributors long before that. In fact our first customer were also Connecticut based.
Please join up, and I look forward to seeing you at our first meeting.
Wednesday, September 14, 2011
Slides from the R for Beginners Meetup in Boston
Last night the Greater Boston Area R User Group had their monthly meeting which featured talks on R for Beginners. The waiting list to go to this talk was longer than those who got to attend! Obviously these kinds of talks are really needed and thanks to this group for doing one and already planning another. Josh has already put the slides up on the site. Here is the Link.
Monday, September 12, 2011
My Memories of 9/11 - Still Horrible after ten years
Every year I dread the anniversary of 9/11. There is not a day that I do not have a memory of that awful day. The anniversaries are even worse for me. All the anger, frustration and helplessness for failing to stop this evil thing from happening just overwhelms me.
The twin towers used to be a happy memory of my youth. I first became aware of them when WPIX Channel 11 in New York adopted them as there symbol in the 70s. For whatever reason I loved those commercials.
When I was in High School I got invited to a big New York Party at Windows on the World. The party was no so great, but I loved the Restaurant and the view! I had never been more than 12 stories above the ground in my life. Amazing!
I went to the towers whenever I was in the city. I loved the place. When I was in college my fraternity had a scavenger hunt that had us streak the top of the Tower. We got away uncaught by the Port Authority cops, and returned to Ithaca with a good story to tell.
After college and grad school I went to lower Manhattan less and less frequently. On September 10, 2001 I bought tickets to a show, and recalling pleasant memories of the towers in years past I made a final reservation at Windows on the World for Friday September 15, 2001. The next morning I watched the towers burn and fall at Eli's in Hamden with Miles Russell, a good friend. Some memories I wish I would forget.
Wednesday, September 7, 2011
Four Tips to get the most out of Floop
Floop is a new iPhone App that takes the mircoblogging of twitter to a whole new level. Floop provides the social media user the ability to gauge the thoughts and opinions of the community dynamically with an opinion graph and text. I think that Floop is both a very entertaining application and a powerful social tool. Here are the things I think you need to do to improve your Floop experience:
- Follow Interesting People: Social Networks are built on associating with interesting and thought provoking people. Floop provides a method to find these people by looking for Floops that you like or by finding an individual's comment on a Floop that interests you. Also just like any social network the people you follow are likely to follow you back.
- Find interesting Floops and participate: This is not hard to do, and it is fun. The quality of your participation is probably more important than the volume of Floops you do. Comments like “yes or “no” add little value to the dialog, but quality comments improve the Floop, and get more people to follow you.
- Create interesting Floops: There is simply no better tool out there is get real time crowdsourced feedback so use it. Test the community’s opinion on your ideas or convictions. The more thought provoking the better.
- Participate in the Floops of people who follow you. Floop's value is in the ability to query the community and for the community to voice its opinion on a topic.
Other than that just enjoy this great new social media application!
Subscribe to:
Posts (Atom)